|
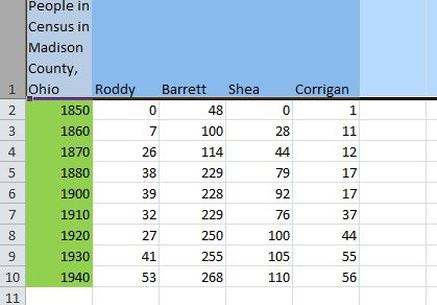
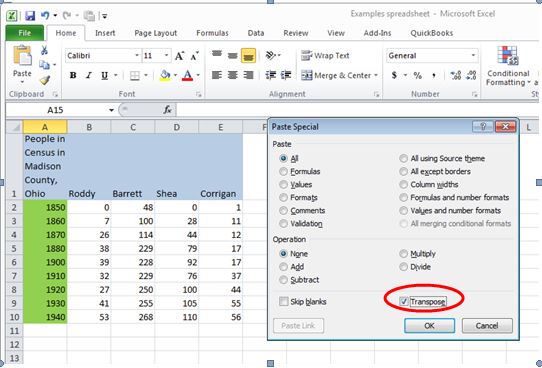
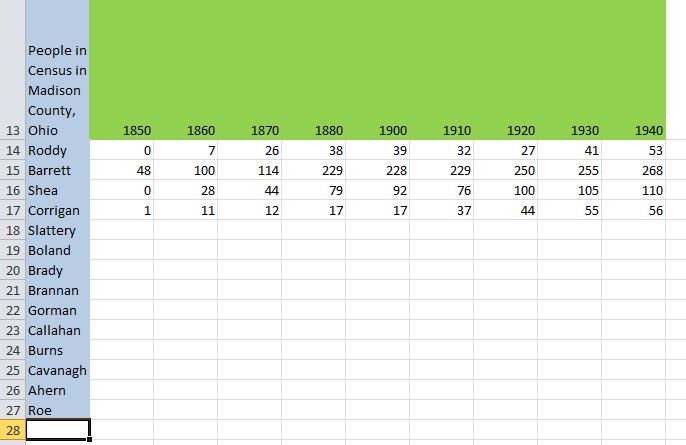
Ever create a spreadsheet, enter a whole bunch of data into it, and realize you set it up wrong? That It would be more useful and functional if the rows were columns and the columns were rows? Here is an example. Here I’ve created a spreadsheet to figure out how any people with various surnames lived in a community across various census years. I listed my nine census years down the left hand side to identify the rows, and I put my four surnames as the column headers. Looks great, but what happens when I find more names to research in that community? My table will just get wider and wider, but not get any taller (at least not until they release the 1950 census.) To my eye, short and wide tables just seem harder to read than tall and skinny ones. By this time I’m feeling a bit like a dodo. If only I’d used the census years (there’s a finite number of those) as the column headers and the surnames as the row titles. Do I have to retype the whole thing? Nope. I can transpose it. Here’s how… Highlight the table, in this example A1 to E10. Click Ctrl+C to copy. Click the cursor in a destination cell elsewhere in the worksheet or workbook (in this example I clicked in A13). Click on the triangle below the Paste icon, then click “Paste Special” and the box shown will appear. Click on the box next to Transpose. And here's what it looks like after, and I'm ready to enter more data! Easy peasy. A few simple steps and now my table looks just like I want it to. And without all that pesky retyping. Yay! Time for more research…
0 Comments
Your comment will be posted after it is approved.
Leave a Reply. |
AuthorMary Kircher Roddy is a genealogist, writer and lecturer, always looking for the story. Her blog is a combination of the stories she has found and the tools she used to find them. Archives
April 2021
Categories
All
|


